
Every public validator
One row per configured key.
Compare validators you operate, delegate to, research, or benchmark by vote state, gossip posture, balances, VAT reserve, runway, and next-leader timing.
Open-source Solana observability
Track validators you run, delegate to, compare, or research by identity or vote-account public key—then read health, leadership, funding, completed-epoch MEV, and operator-supplied cost budgets in six Grafana dashboards.
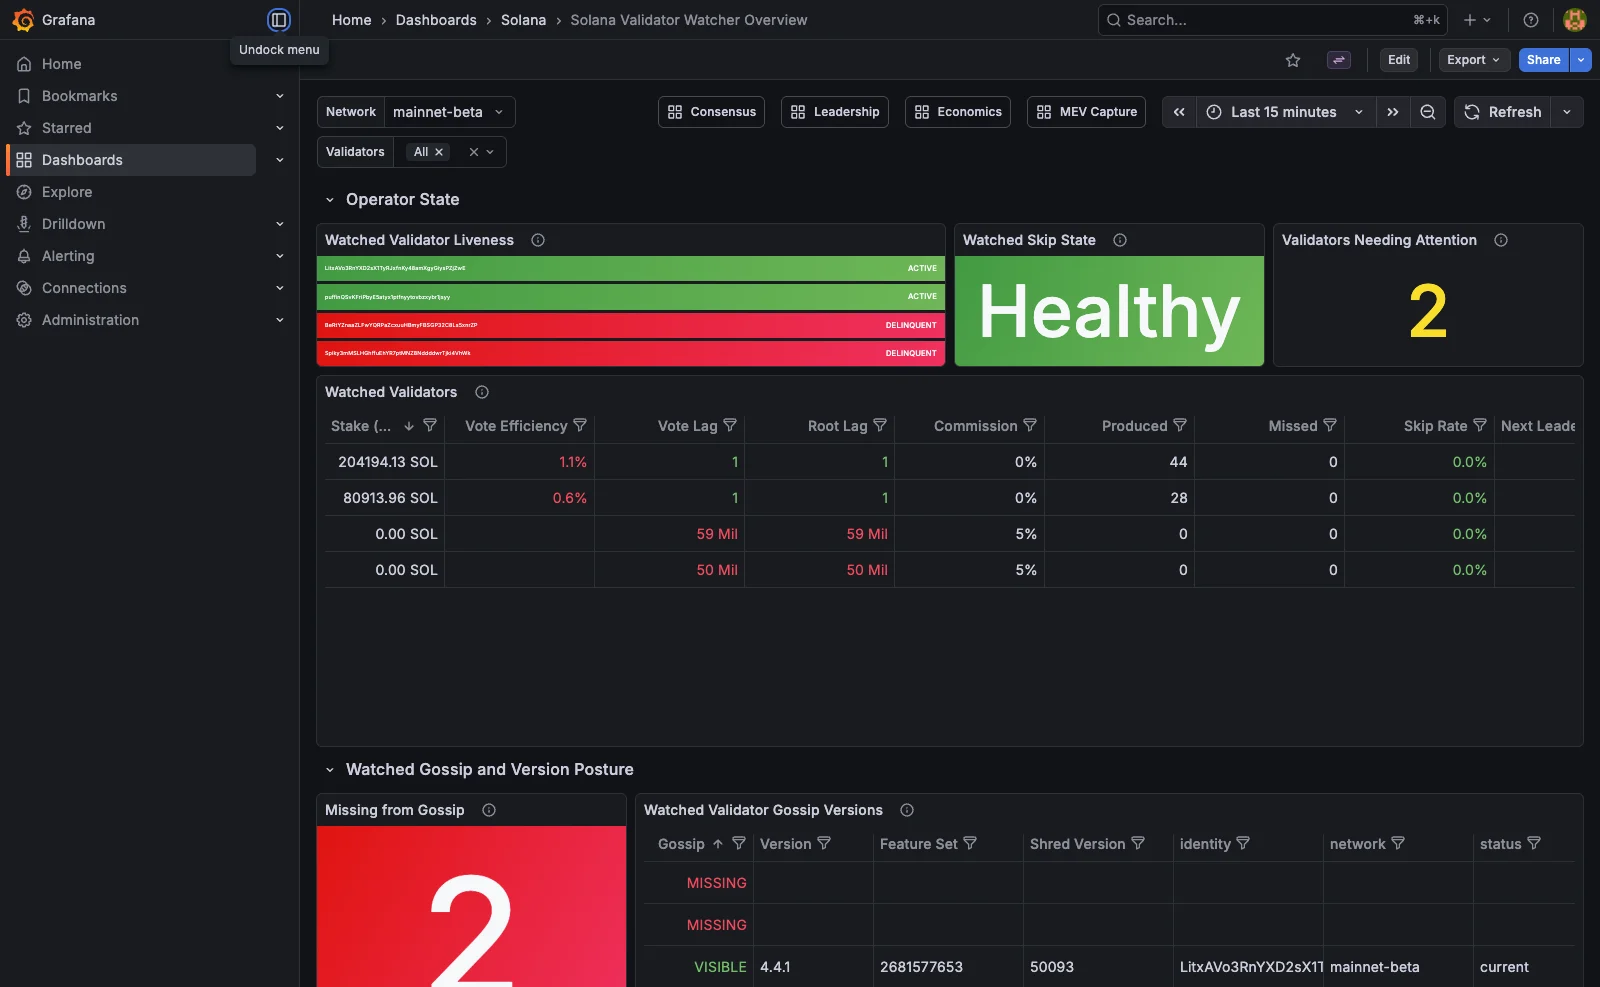
Four dashboard previews
Move from network-relative voting and upcoming leader slots to account runway and completed-epoch MEV for any configured validator key.
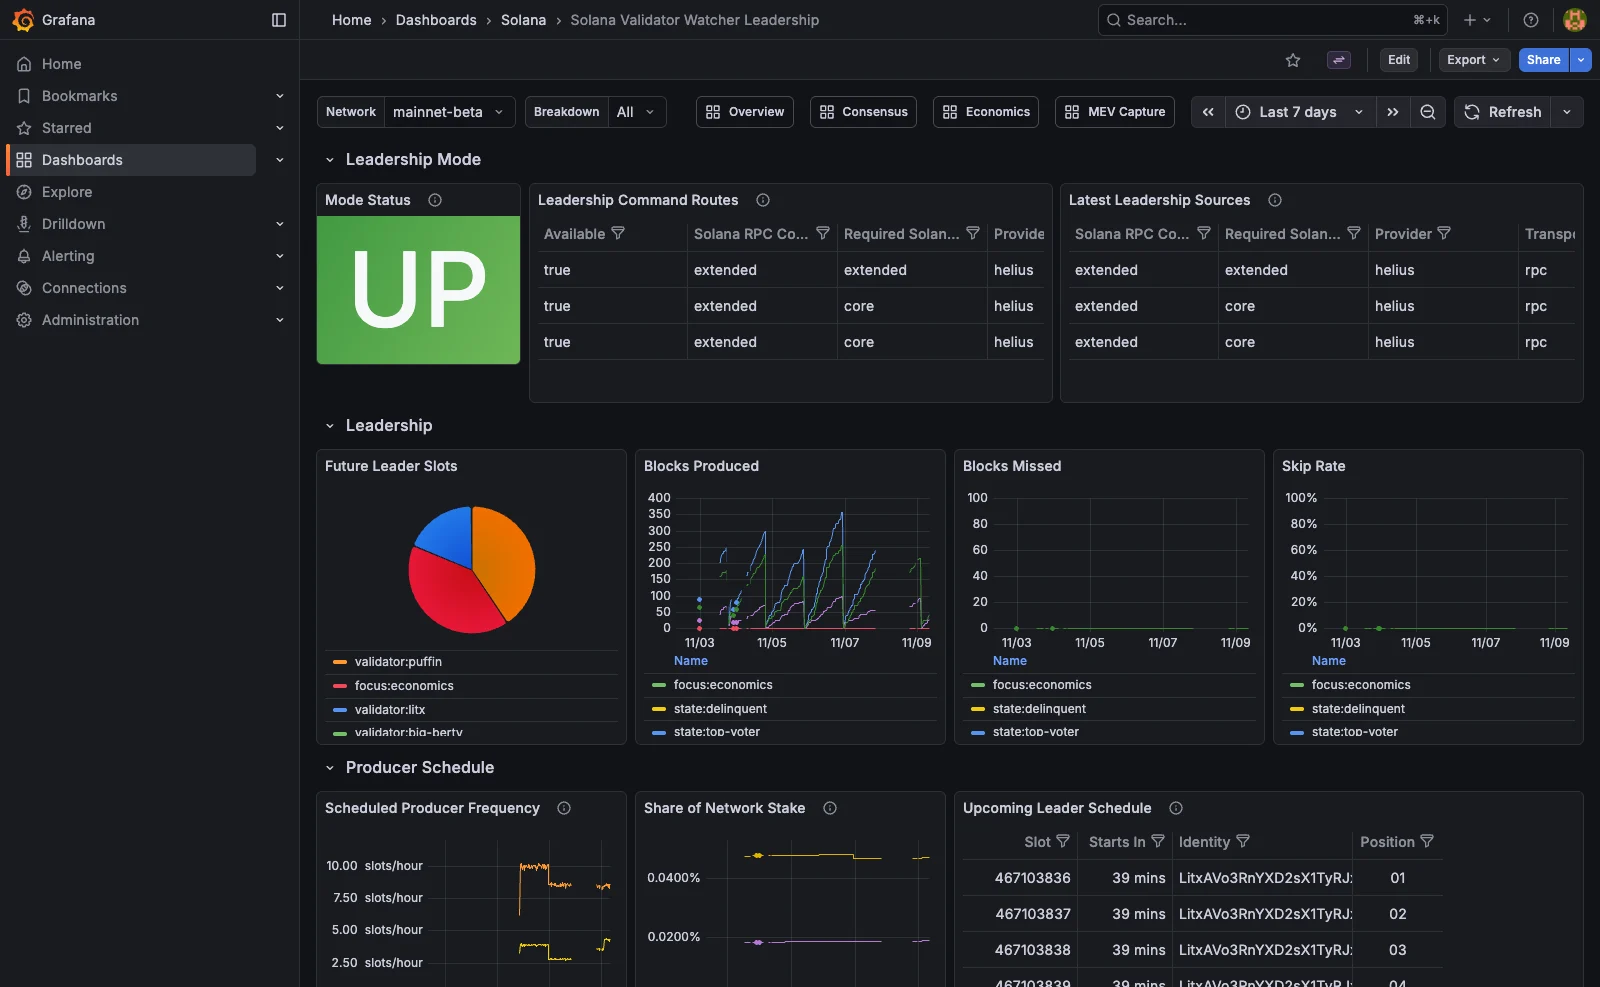
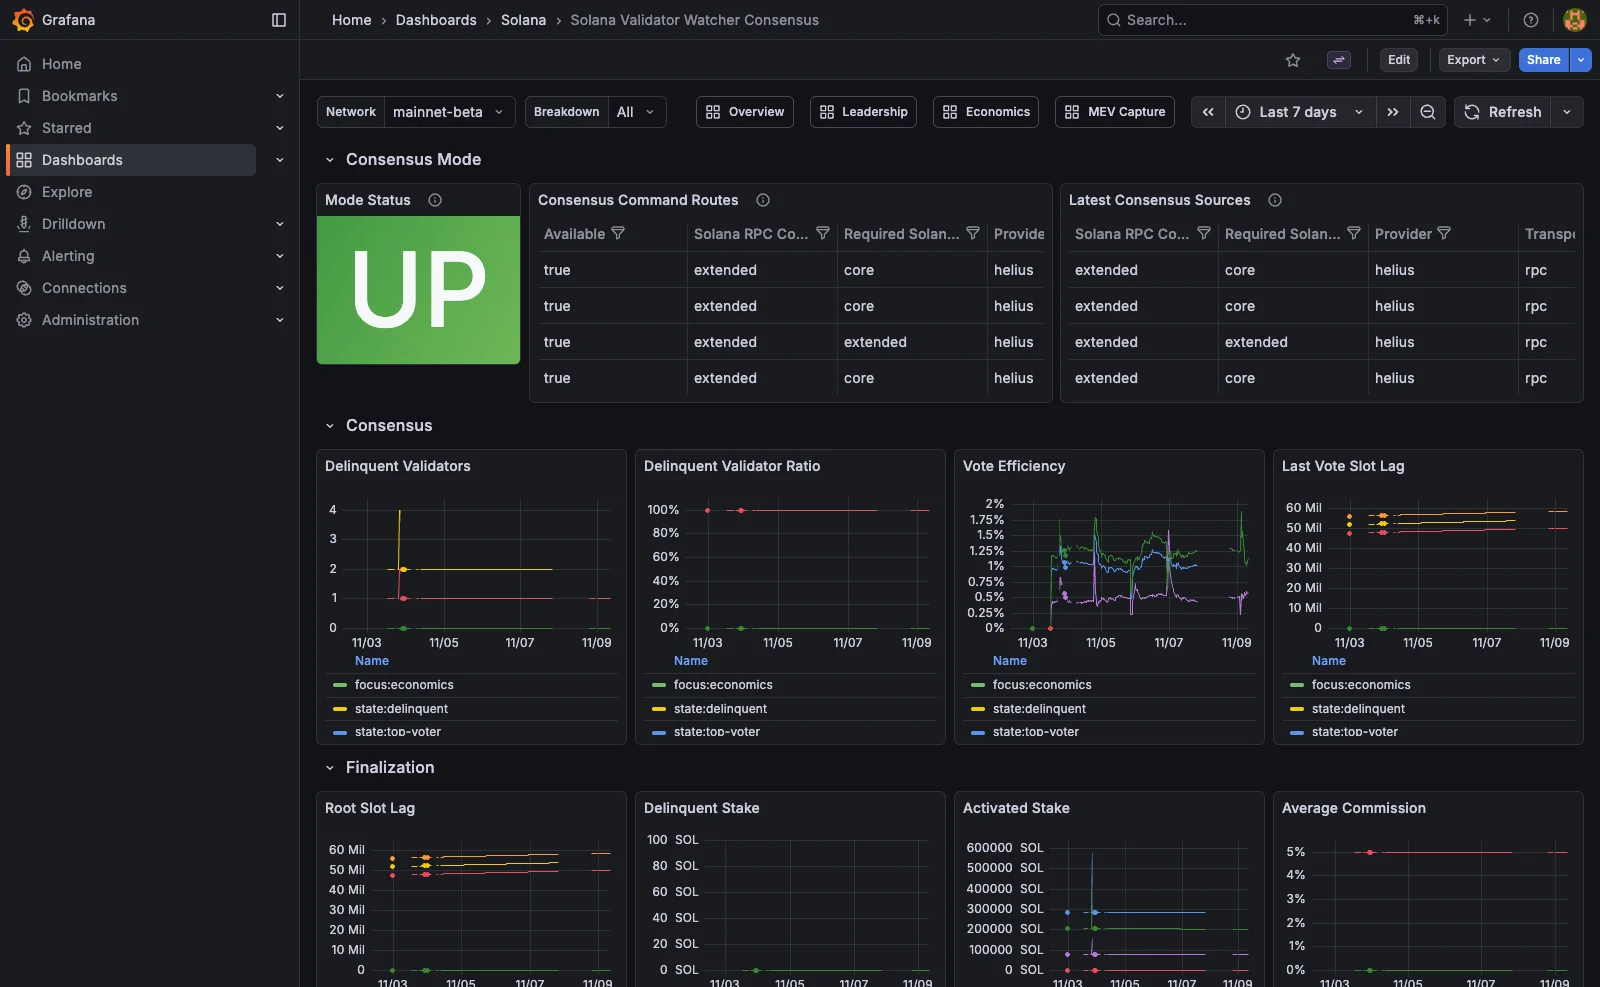
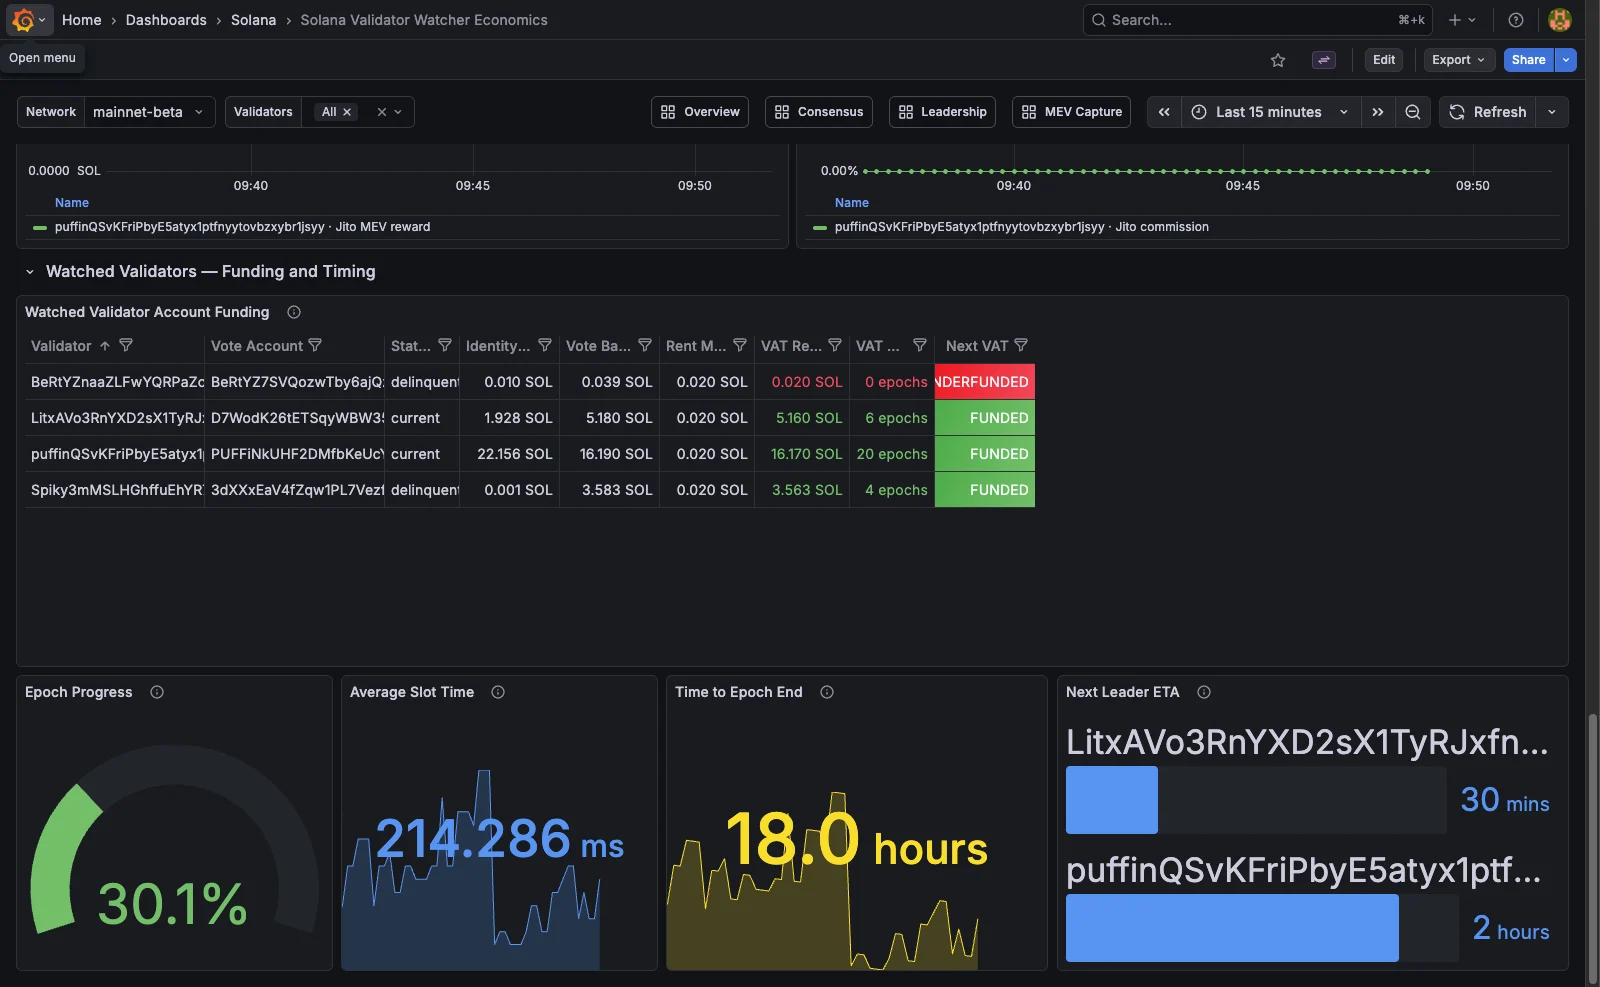
Key-first workflow
Start with a configured validator key and snapshot availability, compare validator state and source degradation with the network, then verify recovery through successful polling rounds.
Detect
Health, readiness, and selected-validator state make the first failure visible without searching across tools.
Diagnose
Vote lag, root lag, skip rate, stake, source provenance, and provider outcomes keep the signal in context.
Verify
Five consecutive complete polling rounds restore readiness; active source failover, failed modes, and stale snapshots stay explicit.
Built for verifiable context
Every view preserves the difference between healthy, unavailable, missing, and stale.
Every public validator
Compare validators you operate, delegate to, research, or benchmark by vote state, gossip posture, balances, VAT reserve, runway, and next-leader timing.
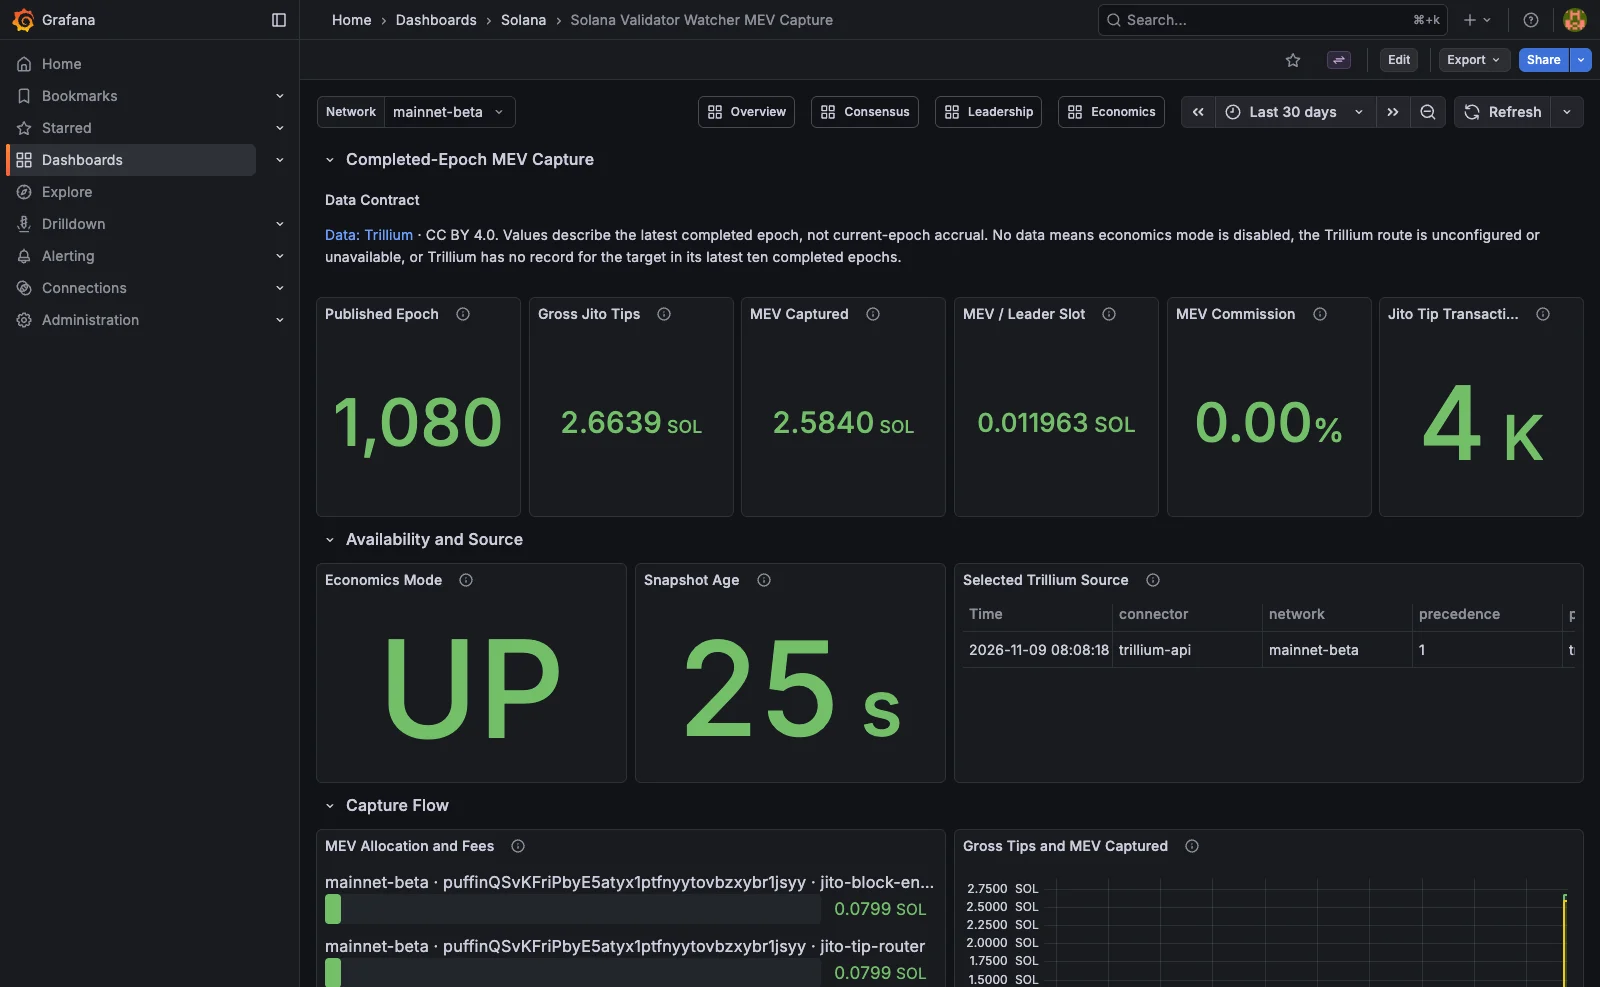
Completed epoch
Trace Trillium capture, Jito tips, commission, fees, allocation, and production from the published epoch—not an implied live accrual.
Named source
Each command follows an ordered compatible route. Prometheus records the connector that succeeded and every failed attempt before it.
Local proof
The repository owns the exporter, provisioned dashboards, Prometheus configuration, and repeatable stack commands.
$ git clone https://github.com/v4lproik/sol-validator-watcher.git
$ cd sol-validator-watcher
$ mise install
$ cp .env.example .env
$ just stack up surfpool

# Grafana → http://127.0.0.1:3001Open source · MIT